School of Population Health
Deprivation and Health Geography within NZ
2013 New Zealand Index of Multiple Deprivation (IMD13)


The IMD project won the People & Community section of the 2018 New Zealand Spatial Excellence Awards. Check out the video (3:46) that we entered for the awards.
Index of Multiple Deprivation
The 2013 New Zealand Index of Multiple Deprivation (IMD) is a set of tools for identifying concentrations of deprivation in New Zealand. It measures deprivation at the neighbourhood level in custom-designed 2013 data zones that have an average population of 712. Data zones are aggregations of census meshblocks (approximately 8 meshblocks per data zone) and in urban settings they are just a few streets long and a few streets wide. They are designed to produce better small area information without losing their contents to suppression or confidentiality.
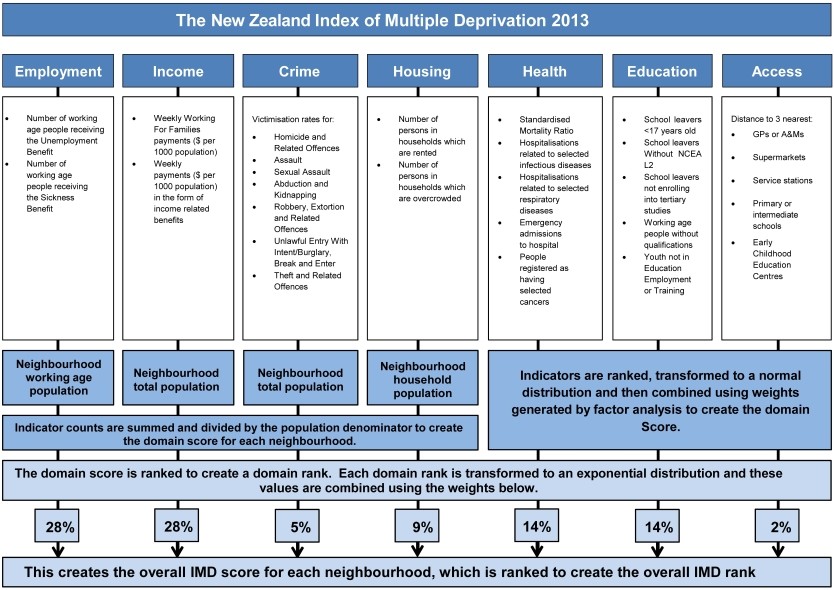
The IMD uses routinely collected data from government departments, census data and methods comparable to current international deprivation indices to measure different forms of disadvantage. It is comprised of 28 indicators grouped into seven domains of deprivation: Employment, Income, Crime, Housing, Health, Education and Access to services. The IMD is the combination of these seven domains, which may be used individually or in combination to explore the geography of deprivation and its association with a given health or social outcome. Figure 1 shows the IMD’s 28 indicators and seven domains with their weightings.
The Index of Multiple Deprivation was developed by the IMD team: Dr Daniel John Exeter, Dr Jinfeng Zhao, Dr Sue Crengle, Dr Arier Chi Lun Lee and Michael Browne, with help and support from numerous individuals and organisations.

Figure 1. Developing the 2013 NZ Indices of Multiple Deprivation: An overview of indicators, domains and weights. Adapted from Figure 4.2 SIMD 2012 Methodology, in Scottish Index of Multiple Deprivation 2012. Edinburgh: Scottish Government (Crown copyright 2012).
The IMD provides a richer, more nuanced view of area level deprivation in New Zealand. Our vision is for the IMD and the data zones to be widely used for community advocacy, research, policy and resource allocation, providing a better measurement of area deprivation in New Zealand, improved outcomes for Māori, equity of service provision, and a more consistent approach to reporting and monitoring the social climate of New Zealand.
The 2013 New Zealand Index of Multiple Deprivation: IMD13 (1204 KB, MS Excel)
Downloadable spreadsheet of the IMD13 with the usual resident population (URP) of data zones, three geographic boundary types, overall deprivation and seven separate domains. There are also seven versions of the index with one domain removed to avoid circularity in analyses that focus on one of the domains.
- The 2013 New Zealand Index of Multiple Deprivation: IMD13 (61 MB, ArcGIS shapefile)
Downloadable ArcGIS shapefile of the IMD13 with the usual resident population (URP) of data zones, three geographic boundary types, overall deprivation and seven separate domains. There are also seven versions of the index with one domain removed to avoid circularity in analyses that focus on one of the domains. The zip file includes two ArcGIS layer files that allow users to reproduce the colour ramp used in the online interactive maps of the IMD
Interactive maps of deprivation in New Zealand in 2013
Use interactive maps to zoom into an area of interest to see its deprivation profile, filter by a particular level of deprivation, compare neighbourhoods or explore different dimensions of deprivation.
The New Zealand land mass was divided into 5,958 small areas called data zones (DZ). The population of 2013 DZs ranges from 501 to 999 with an average population of 712, with the exception of one DZ representing all of Stewart Island (total population of 384) and 10 large DZs with populations between 1,381 and 1,899 (mostly comprising a single Meshblock).
- Downloadable spreadsheet linking 2013 Meshblocks to 2013 data zones. Coastal and inland waters are excluded (1160 KB, MS Excel)
- Downloadable spreadsheet linking 2013 and 2018 Meshblocks to 2013 data zones. Coastal and inland waters are excluded (1537 KB, MS Excel)
- ArcGIS shapefile containing 2013 data zone boundaries, along with District Health Board, General Electoral District and Territorial Authority boundaries (61 MB, ArcGIS shapefile)
Reports and publications
-
The New Zealand Indices of Multiple Deprivation: a new suite of indicators for social and health research in Aotearoa, New Zealand is a 2017 article in the PLOS ONE journal about the development of the NZIMD and NZ data zones.
-
Developing intermediate zones for analysing the social geography of Auckland, New Zealand is a 2016 article describing the creation of two new geographical boundary files known respectively as lower zones and upper zones for investigating social phenomena and visualising disparities in health outcomes in the Auckland Region. The same methodology was used to develop 5958 data zones for the whole of New Zealand.
A brief report on development of the New Zealand Index of Multiple Deprivation (IMD). (754 kB, PDF)
A compilation of 20 deprivation and demographic profiles of New Zealand's District Health Boards (DHB) using the 2013 Index of Multiple Deprivation (IMD13) and the 2013 Census (9 MB, PDF)
Geocoding addresses and generating deprivation profiles for selected geographic areas using IMD13
This advanced interactive map allows you to geocode single or batch addresses and generates a deprivation profile for selected geographic areas (e.g. Mt Albert GED, Thames-Coromandel District, Southland DHB, Canterbury Region) using IMD13. You can also use this map to search on a single address (e.g. your home address).
The IMD Qualtrics Survey Module allows people conducting surveys to obtain a deprivation profile of the respondent’s neighbourhood by asking them to enter their home address. The module returns the data zone ID for that address and embeds its deprivation profile (overall IMD13 deprivation and 7 domains) expressed in quintiles. The 2013 data zone ID and the deprivation information are saved to the main survey output.
Organisations that contributed to the development of the IMD
The research team are grateful to the Health Research Council of New Zealand for funding this research project. This research would not have been possible without the provision of data, expert guidance and support of many individuals and the following organisations: Accident Compensation Corporation, Action on Smoking and Health, Aotearoa People's Network Kaharoa, ANZ Bank, ASB Bank, Association of Public Library Managers Inc., Auckland Uniservices Ltd, Auckland University of Technology, Beacon Pathway, BNZ Bank, BRANZ, Child Poverty Action Group, COMET Auckland, Counties-Manukau DHB, Department of Corrections, Energy Efficiency and Conservation Association, Family Start, Federated Farmers, Heart Foundation, Housing New Zealand Corporation, Inland Revenue, Kiwibank, Leeds University, Maritime NZ, Massey University, Ministries of Business, Innovation and Employment, Education, Health, Justice and Social Development, National Collective of Independent Women’s Refuges, Ngāti Whātua o Ōrākei, Northland DHB, New Zealand Certified Builders Association, NZ Fire Service, NZ-Libs, NZ Police, NZ Post, NZ Racing Board, Royal New Zealand College of General Practitioners, Ollivier & Company, Otago University, Participants in the Feb 2014 and Feb 2017 hui, Pharmac, Plunket, Prisoners Aid and Rehabilitation Trust, Problem Gambling Foundation, Salvation Army, St John's Ambulance, Southern African Social Policy Research Institute, Statistics New Zealand, TSB Bank, Tairāwhiti DHB, Te Kāhui Mana Ririki Trust, Te Kupenga Hauora Māori, Te Matapihi he tirohanga mō te iwi Trust (National Maori Housing Trust), Te Rūnanga o Ngāti Hine, Te Wānanga o Aotearoa, Te Whānau O Waipareira Trust, Telco2 Ltd, Tenancy Tribunal, University of Auckland, University of Canterbury, University of Otago, University of Oxford, Waikato University, Waitemata DHB, Wellington Free Ambulance, Westpac Bank, and Woopa Design.


